It’s February 14th, love is in the air, and we’ve got the scoop on what people are shopping for, plus how they’re completing all those (sweet) buys. From device-driven data to cross-purchasing behavior, our insights—drawn from over 1.2 billion digital purchases last year—reveal some interesting trends. Ever wonder what items are most often bought together or alone, or which device leads in sales? Find out in the infographic below, and scroll to the bottom for the keys to shoppers' hearts.
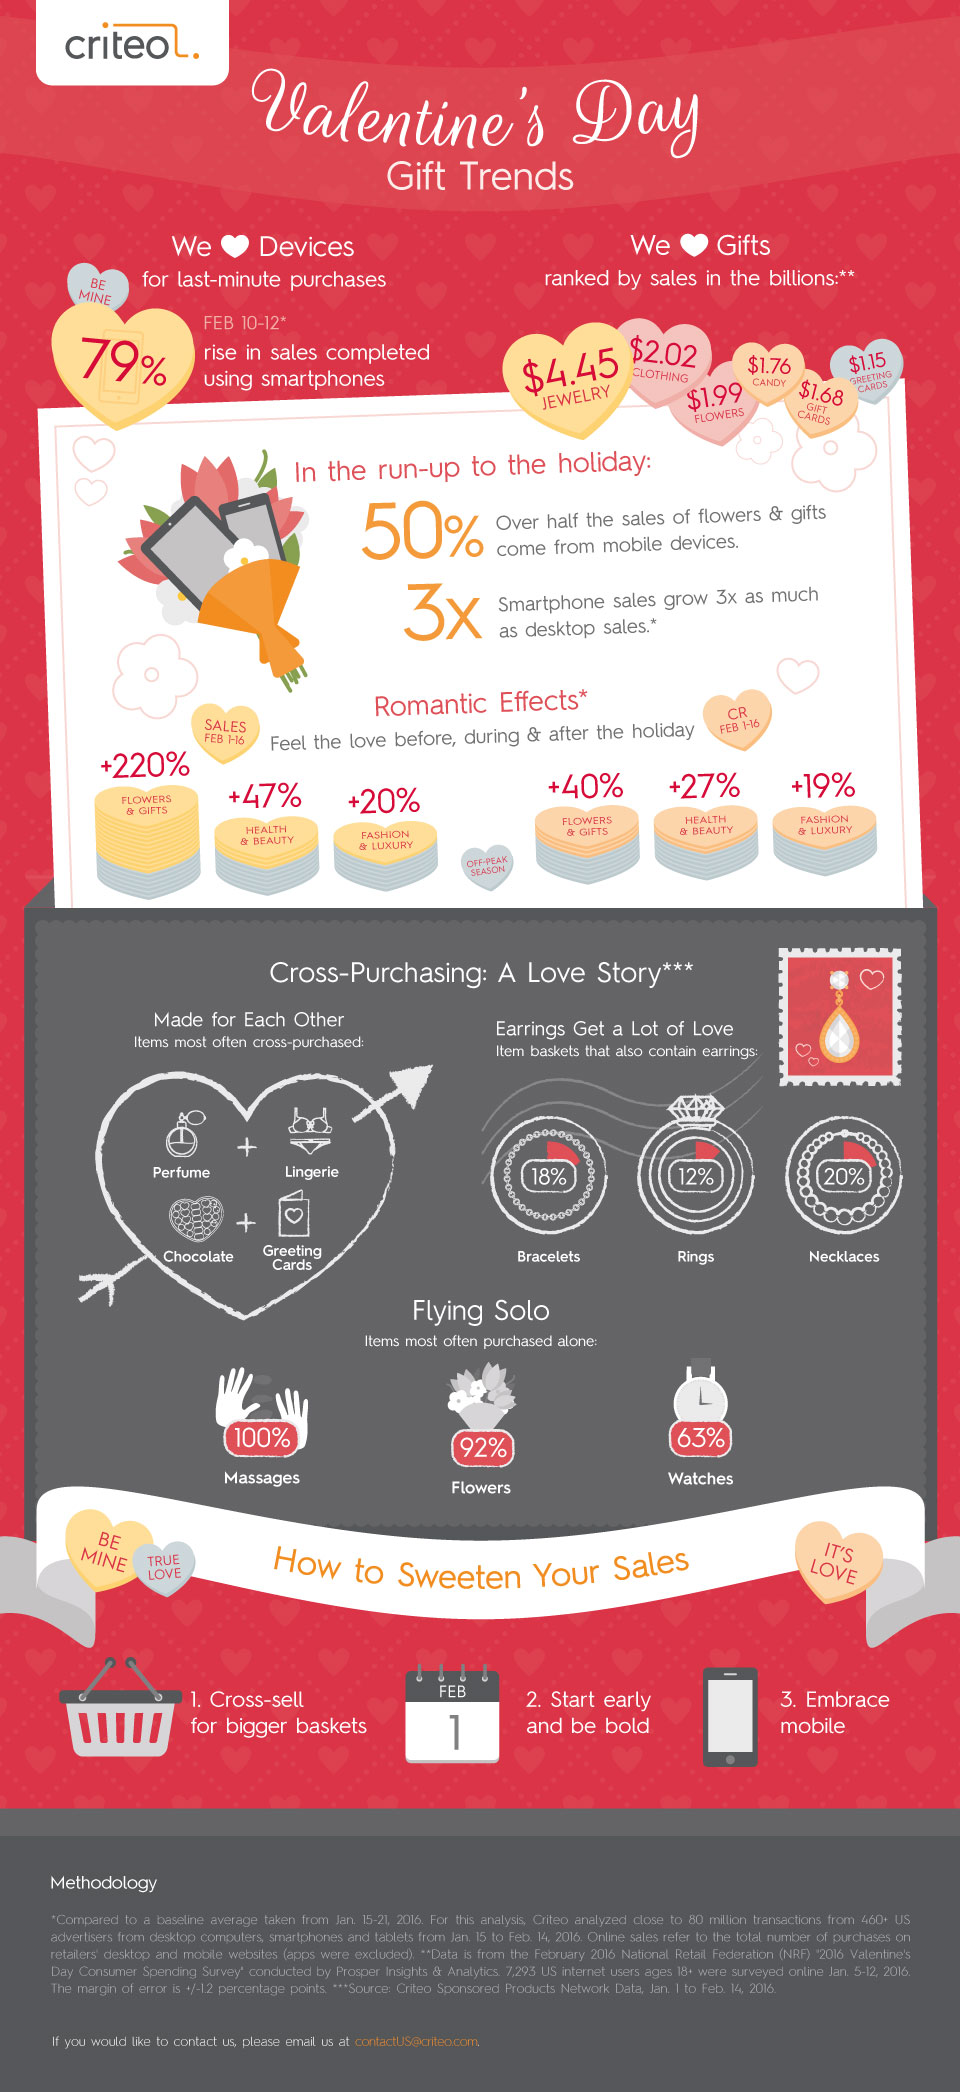
- Cross-purchasing is an everlasting love. When it comes to shopping carts, perfume and lingerie tend to hug it out, while chocolate and greeting cards go hand in hand. Items often purchased solo include massages, flowers, and watches.
- Earrings are hot, hot, hot. Last year, 20% of digital shopping carts that had necklaces also contained earrings. They’re also popular additions to baskets with bracelets and rings.
- Last-minute buys are a mobile affair. For purchases made Feb. 10-12, sales on smartphones rose 79%. Over half the sales of flowers and gifts during this period came from mobile devices, and mobile sales increased 3X as much as desktop transactions.
- Romantic effects last through Feb. 16th. Sales and click rates see a steady rise from Feb. 1st all the way to Feb 16th, so it’s not too late for retailers to take advantage of the holiday’s heartwarming (read: sales) benefits.
< Back to blog
Categories:
Infographics